📅 March 2024
🧑 I. Cristina Plajer, A. Băicoianu, L. Majercsik, M. Ivanovici
#Multisource multispectral (MS) and hyperspectral (HS) images #neural network #normalization #remote sensing #standardization #visualization
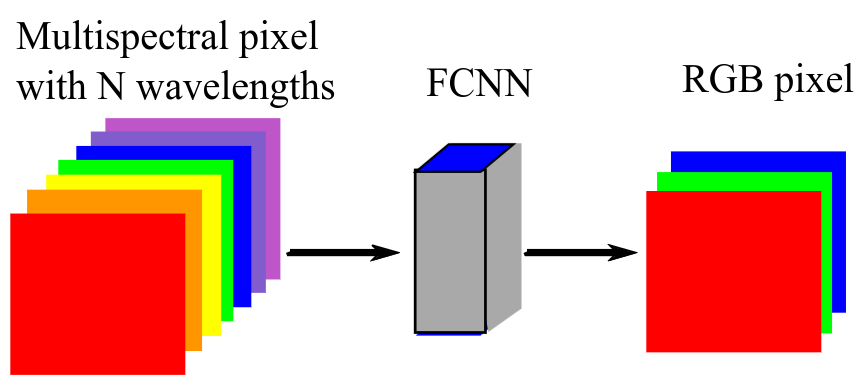
With the availability of several remotely sensed data sources, the problem of efficiently visualizing the information from multisource data for improved Earth observation becomes an intriguing and challenging subject. Multispectral (MS) and hyperspectral (HS) images encompass a wealth of spectral data that standard RGB monitors cannot replicate directly. Thus, it is important to elaborate methods for accurately representing this information on conventional displays. These images, with tens to hundreds of spectral bands, contain relevant data about specific wavelengths that RGB channels cannot capture. Traditional visualization methods often use only a limited amount of the available spectral information, resulting in a significant loss of information. However, recent advances in artificial intelligence models have provided superior visualization techniques. These artificial Intelligence (AI)-based methods allow for more realistic and visually appealing representations, which are important for the information interpretation and direct identification of areas of interest. The main goal of our study is to process aggregated datasets from various sources using a fully connected neural network (FCNN), while considering visualization as a secondary objective. Given that our data come from a variety of sources, a significant emphasis in our study was placed on the preprocessing stage. In order to achieve a consistent visualization across datasets from different sources, proper preprocessing by standardization or normalization procedures is essential. Our research comprises numerous experiments to demonstrate the effectiveness of the proposed technique for image visualization.
https://ieeexplore.ieee.org/document/10458686
Plajer, I.C., Băicoianu, A., Majercsik, L. and Ivanovici, M., 2024. Multisource remote sensing data visualization using machine learning. IEEE Transactions on Geoscience and Remote Sensing.
@article{plajer2024multisource,
  title={Multisource remote sensing data visualization using machine learning},
  author={Plajer, Ioana Cristina and B{\u{a}}icoianu, Alexandra and Majercsik, Luciana and Ivanovici, Mihai},
  journal={IEEE Transactions on Geoscience and Remote Sensing},
  year={2024},
  publisher={IEEE}
}
